Made By Andrew Thompson
Decoding Purdue
An Analysis of Purdue's GPA
Andrew Thompson (CS & DS, Junior) • Sam Lau (Math & Stats, Senior)
Bryce Bogan (Stats, Sophomore) • Weichang Wang (CS & DS, Senior)
This portfolio will show our group's many visualizations, insights, and our methods through the entire data visualization process.
Our Data Visualization Process
This section will go through the first few steps of the data visualization process that we followed for this project.

Acquire
To acquire our dataset covering GPA distributions for a range of courses, subjects, terms, and professors, we downloaded the data from a website called boilergrades.com, which was made available by a public records request.
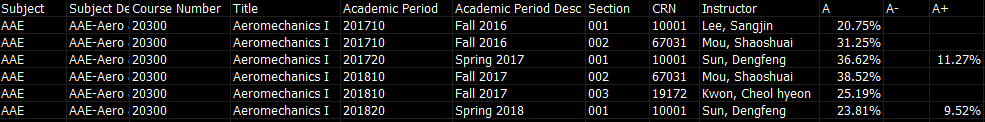

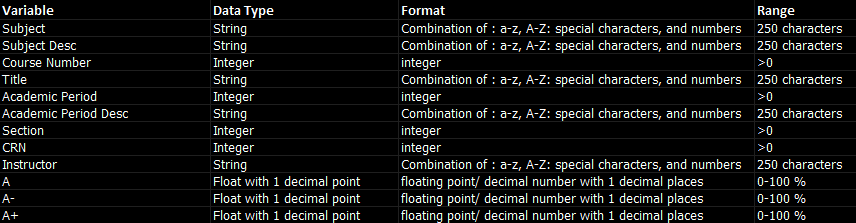
Parse
To parse this dataset, we wrote out the datatype, format, and range of each variable. In excel, the correct data format was selected for each column to make it more readable.

Filter
The data was then filtered to remove Pass/Fail courses that did not have a normal grade distribution, and any classes with a withdrawal rate greater than 80% were removed as well. Later in the process, the datasets for many visualizations also filtered out any courses or subjects that have a small number of sections to get only the larger observations that have more significance.

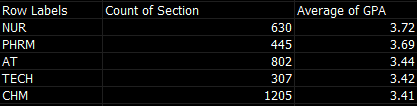
Mine
Next, we mined the data by getting the sum of the population and used this with the grade distribution to get an average GPA for each course. We then created multiple pivot tables to sum every section across each course and subject, as well as match up each professor with every class he or she teaches. These pivot tables were then used in the following stages of the visualization process.
Visualizations & Insights
This section serves to showcase the various visualizations that our group has created to give insight into what the relationship is between GPA and numerous factors at Purdue.
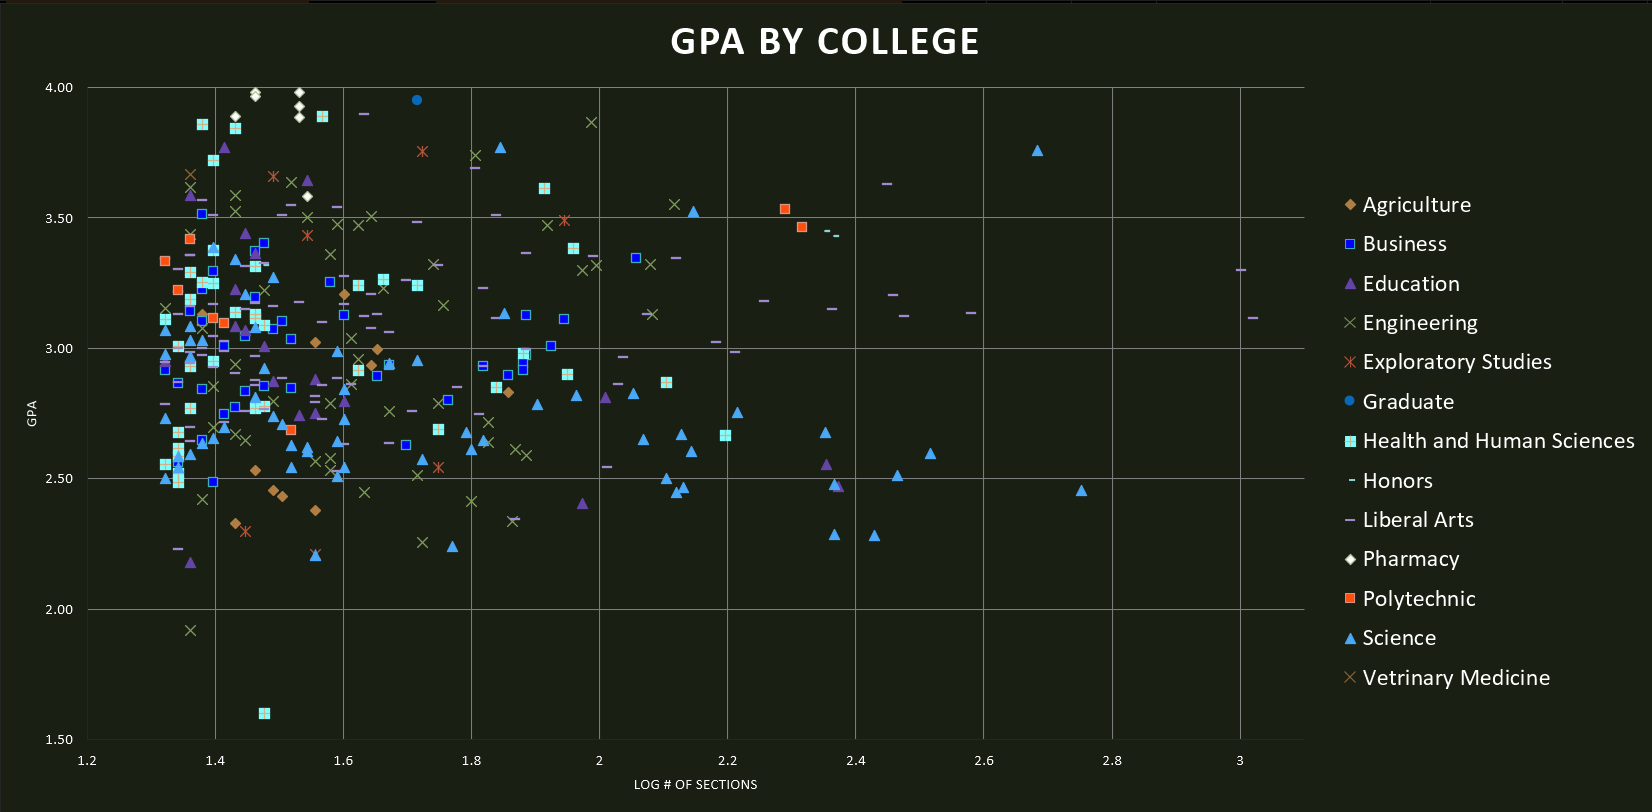
Both Science and Liberal Arts have clusters of courses with a high number of sections, however, Science's cluster has a lower GPA than the Liberal Arts cluster.
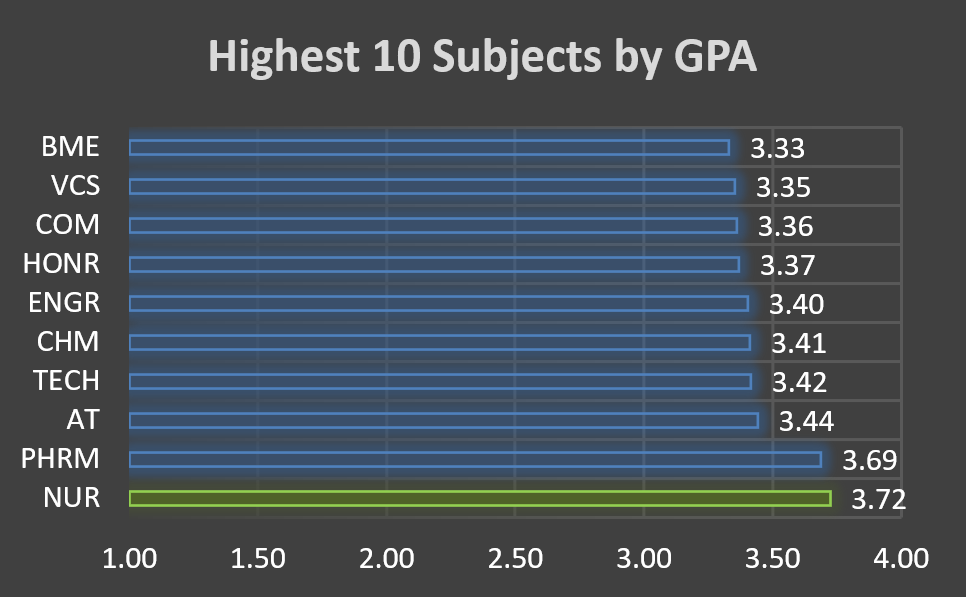
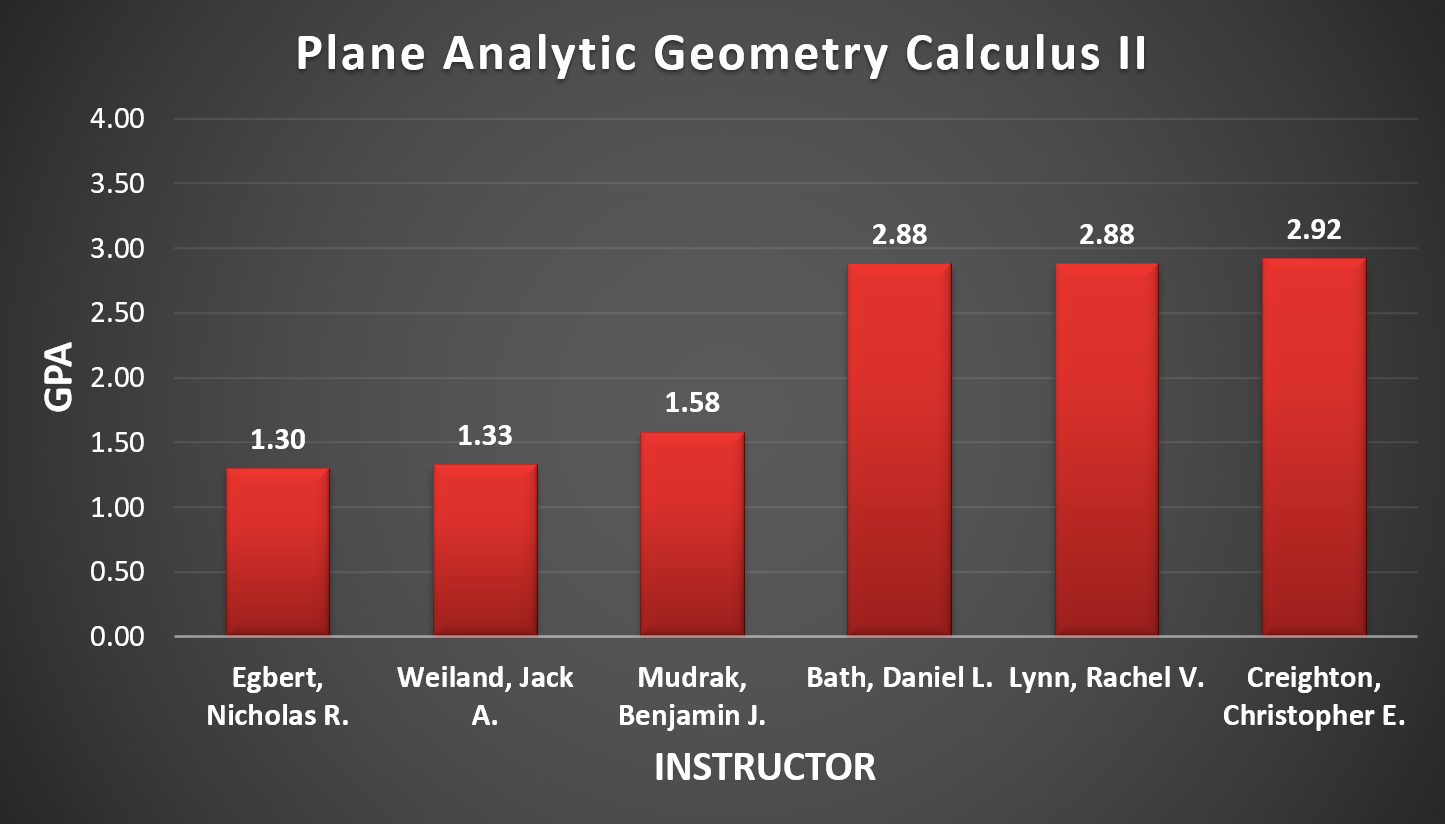
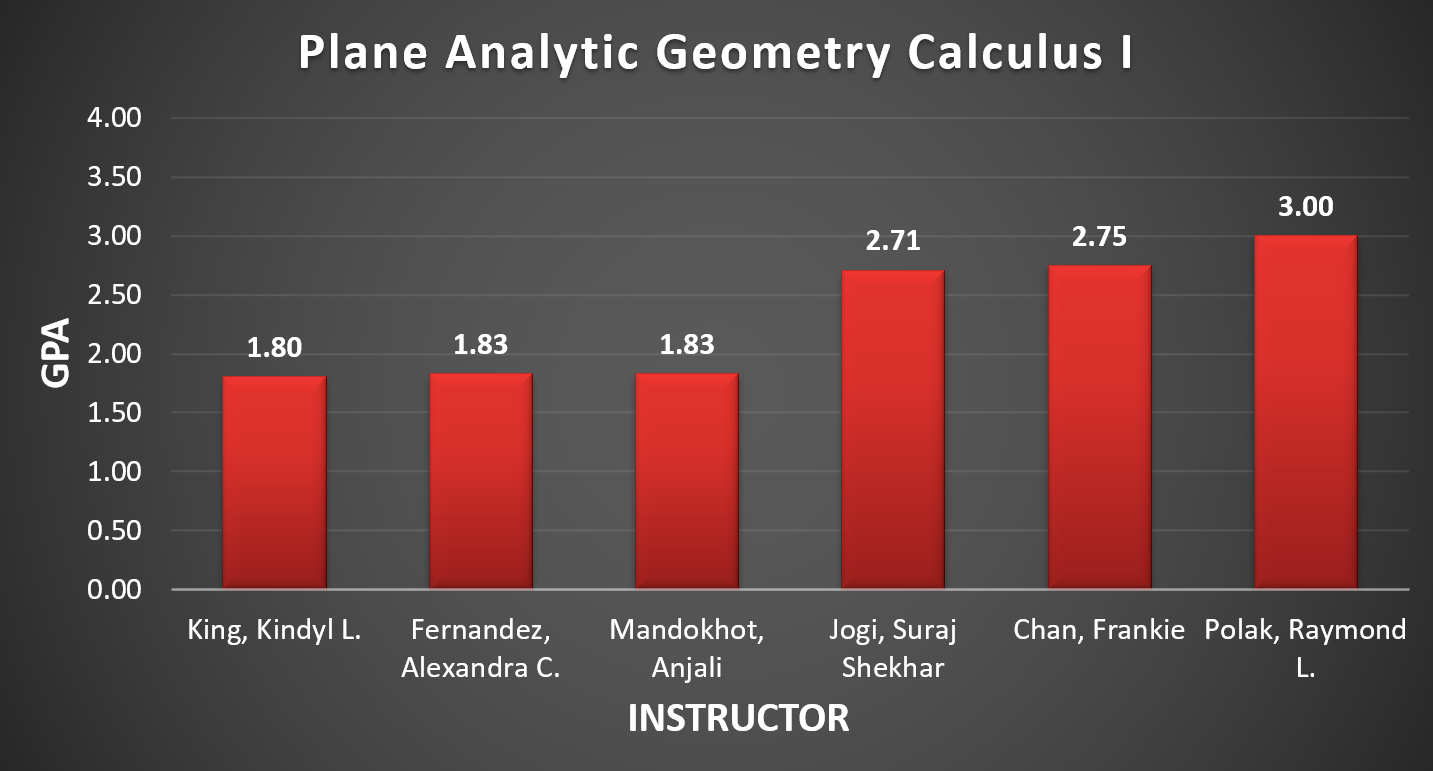
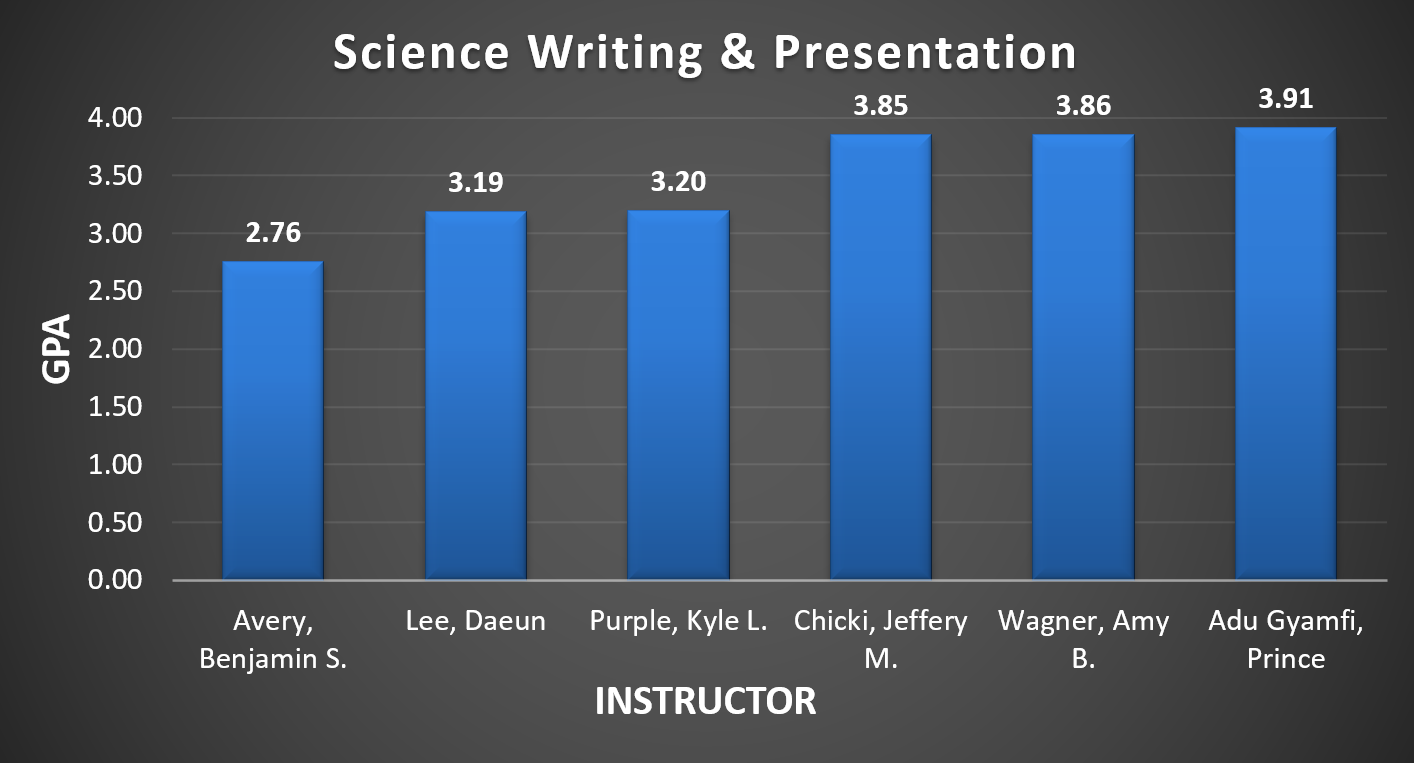
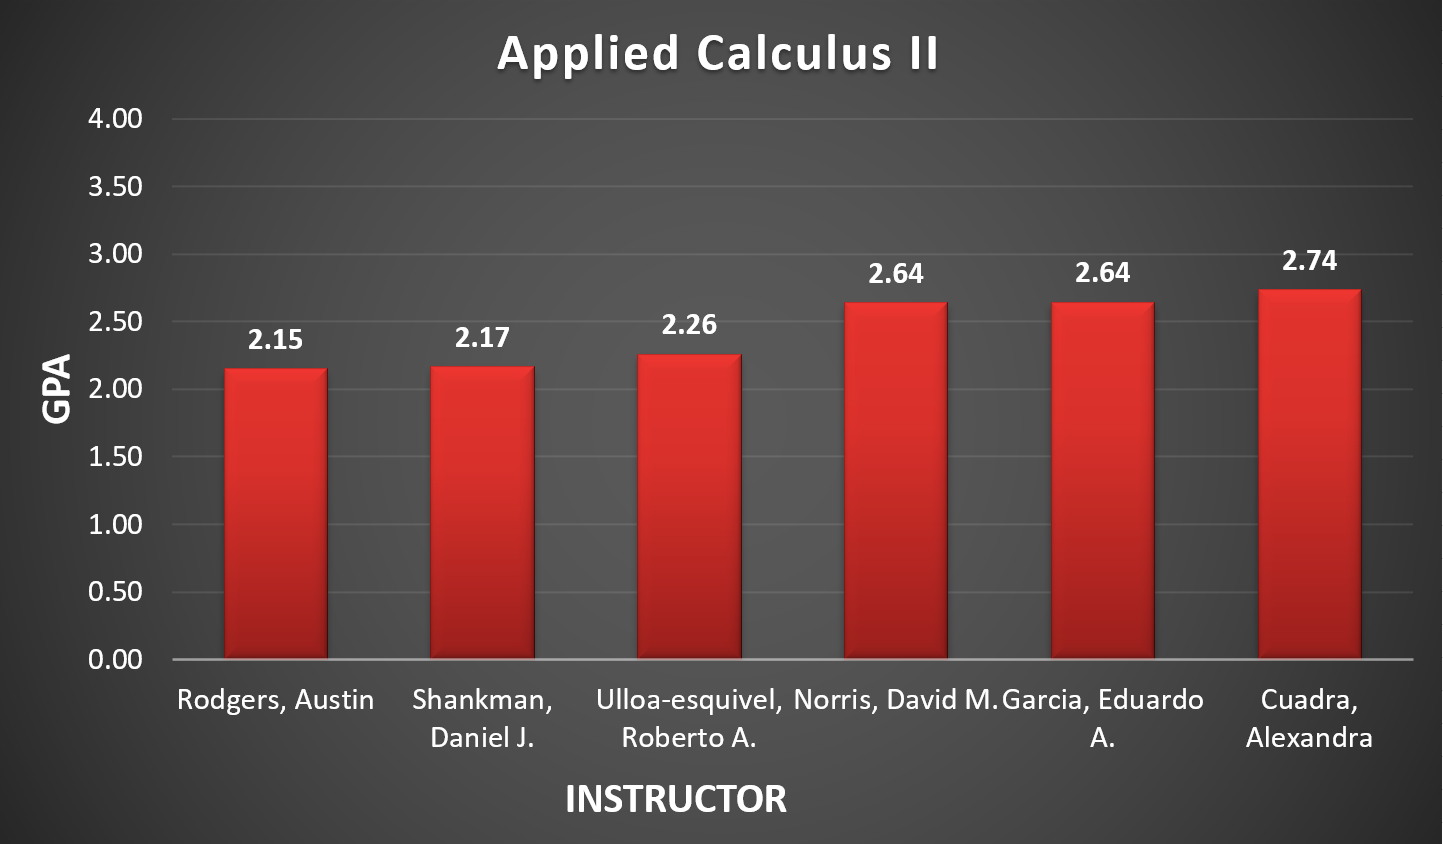
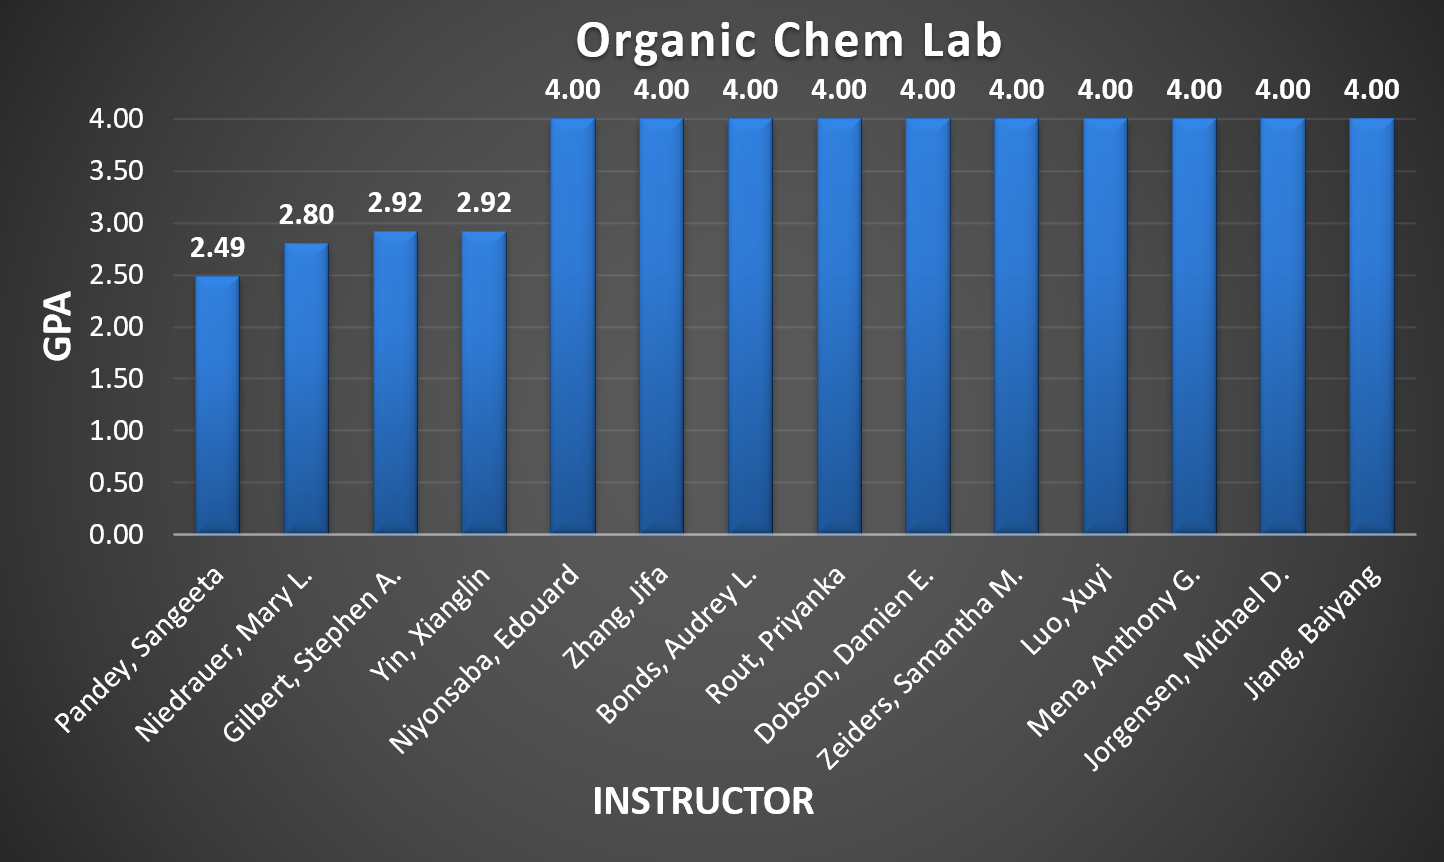
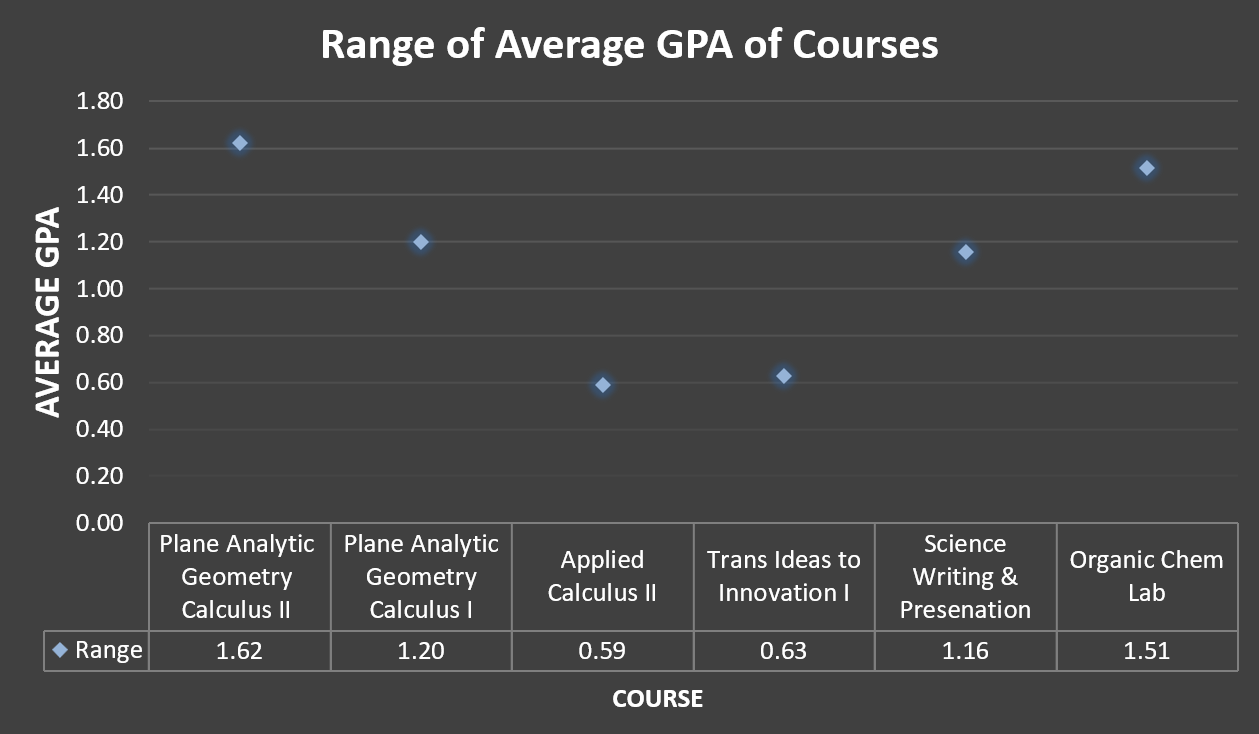
Analysis of the Lowest and Highest GPA Courses by Professor

Continue Reading
If you would like to get an even more in-depth look at our work, feel free to visit the Paper tab at the top of the page. You can also visit the Video tab to see our final presentation via youtube, or the Visualization Gallery tab to see all of our visualizations in one convenient location, along with an interactive dashboard.